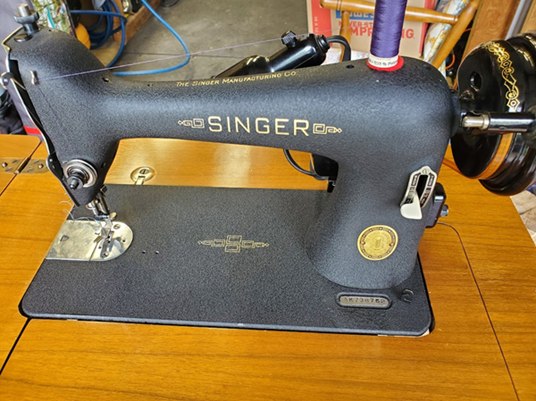
It is often said that Singer made millions of sewing machines. I wanted to get beyond that general statement. How did the machines on my bench compare with one another? Which designs dominated the records, and how did that change over time?
That curiosity led me to combine and compare the serial-number tables published by the International Sewing Machine Collectors’ Society (ISMACS).
This section brings that work together with my interest in collecting and refurbishing vintage domestic Singers. The aim is to connect the individual machine with its model family, manufacturing background, and place in the broader record.
What the Numbers Represent
My original analysis covers 1900–1963 and totals approximately 77.1 million across the records included. That is the scope of this analysis, not a claim to have counted every Singer made worldwide during those years.
The figures compare broad model groups and the quantities recorded against them. The records include serial-number allocations, which do not establish the exact day an individual machine was completed. The grouping choices and other details are explained in the methods footnote.
Which Model Groups Dominate?
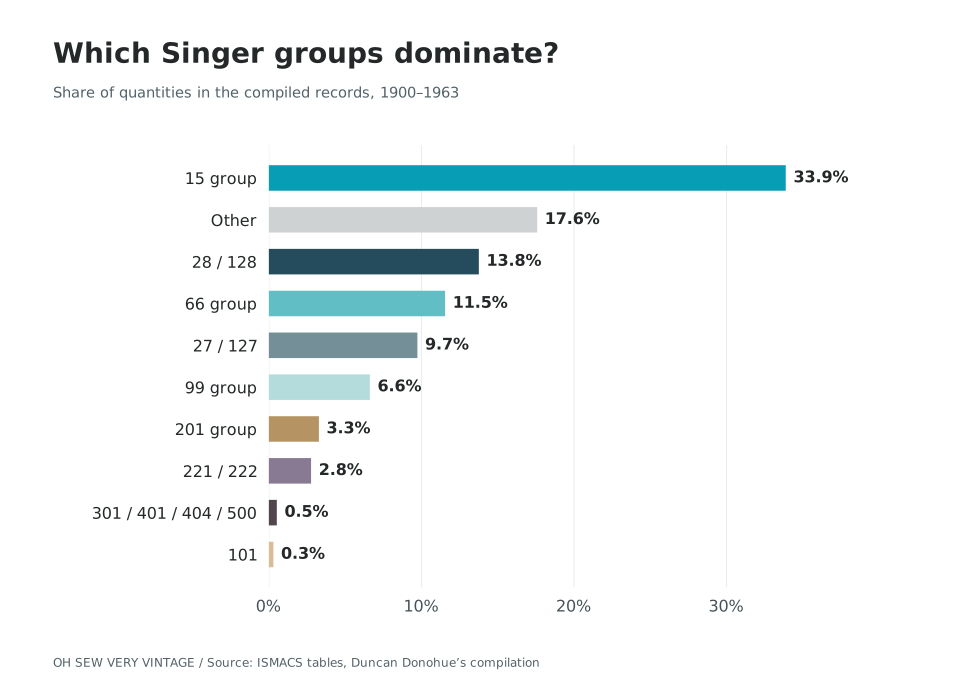
Figure 1. Relative shares in my original 1900–1963 compilation. Labels denote grouped categories; “other” includes industrial machines and models outside the selected groups.
The Model 15 group accounts for about 33.9% of the total in this compilation. The two vibrating-shuttle groups—27/127 and 28/128—together account for roughly 23.5%. The Model 66 group contributes another 11.5%.
Those comparisons help put the machines I encounter into perspective, showing how familiar models fit into the broader record.
Explore the Singer 15 and Singer 66 for the features behind those model groups.
Full-Size and Compact Machines
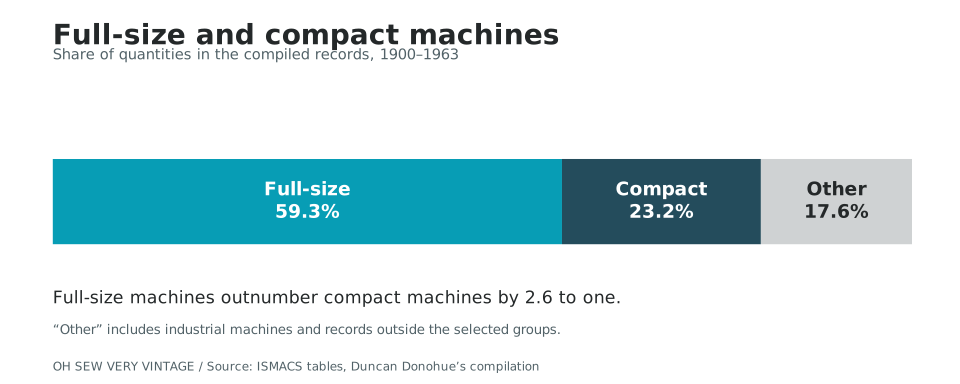
Figure 2. Full-size machines account for 59.3% of the compiled total, compact machines 23.2%, and other machines 17.6%. Percentages are rounded.
Within the groups classified by size, full-size machines outnumber compact machines by about 2.6 to one. The “other” category remains separate: it should not be read as a third physical size.
This offers another way to compare the familiar machines on a collector’s shelf. See the methods footnote for the models included in each size category.
How the Pattern Changes Over Time
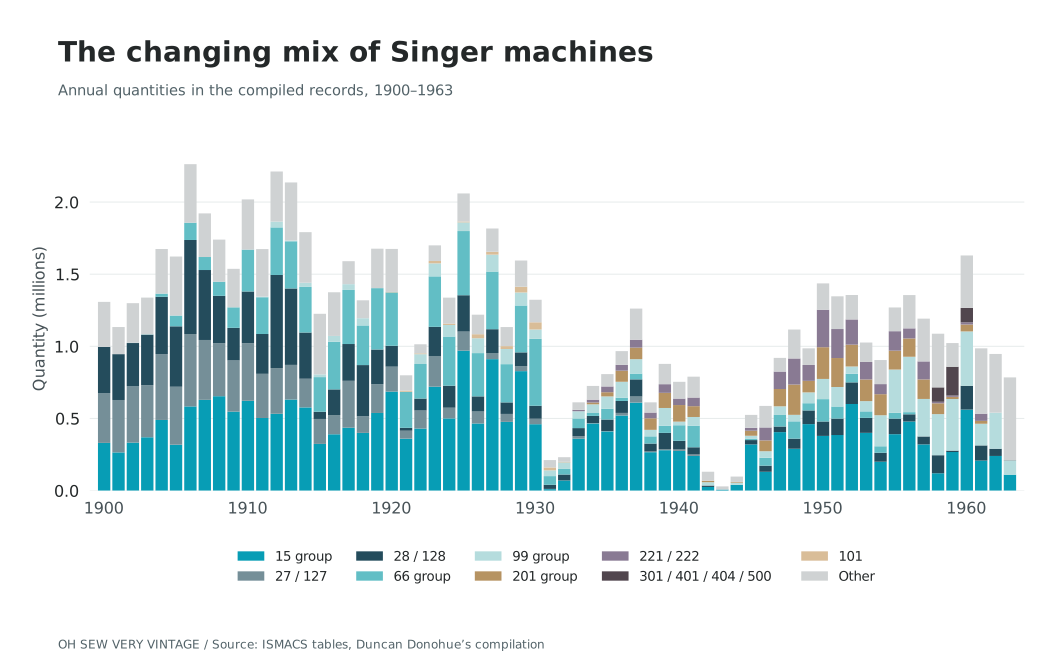
Figure 3. Annual totals in the original compilation, colored by analytical model group. The vertical axis is the summed quantity in the included records.
The annual chart adds something the overall percentages cannot show: the mix of models changes substantially over the period.
The early years show large contributions from the Model 15 and vibrating-shuttle groups. Later in the chart, those proportions shift, with greater contributions from other selected families.
There are also pronounced troughs, particularly in the early 1930s and the 1940s. These invite comparison with economic conditions and wartime disruption, but the chart alone does not establish the cause of a rise or fall. Record coverage and the timing of allocations also need to be considered.
The detailed production article will examine those patterns alongside the underlying records.
Following the Machines Back to Their Origins
Numbers are one part of the story. The model guides will look at identifying features, variants, and examples from my collection, beginning with the Model 15 and Model 66.
The methods note below explains the grouping decisions, ambiguous entries, and limits of the analysis.
Together, these pages are intended to make the history useful at the workbench: a way to understand the machine in front of you, as well as the larger story behind it.
Methods footnote: scope and model groups
The figures sum the quantities in my compilation of ISMACS serial-number tables from 1900 through 1963, a total of 77,118,491. The endpoint is the last year with a positive quantity assigned to the 15 group in this compilation; it does not establish when Model 15 production ended worldwide. The AA-series table, for example, describes quantities and dates as allotted. Allocation dates and quantities should not automatically be treated as exact completion dates or a complete count of worldwide production.
The model groups follow my original analysis with two revisions: the six entries explicitly labeled Model 1200, totaling 6,500 machines, are now included in the 201 group rather than “other”; and the 15,000 industrial Model 281K23 machines recorded in 1959 are included in “other” rather than the 28/128 group. These are comparison categories, not new Singer model classifications. Listed variants were matched explicitly, so an unlisted designation remains in “other.”
| Figure label | Designations included in the analysis |
|---|---|
| 15 group | 15, 15-88, 15-30, 15K, 15k, 15K77, 15K80 & 88, 15K80, 15K 80 & 88, 15K110, 15K110 & 191K, 15K80-88, 15K110191K1, 15K110-191K, 15K-191K, 15K80-82, 15K C.S., and 15k C.S. Mixed 15/191 entries remain combined. |
| 101 | 101 |
| 201 group | 201, 201K, 201k, 201K23, 201K29, and 1200. Combined quantity: 2,529,818. |
| 221 / 222 | 221, 221-1, 221K, 221k, and 222K |
| 27 / 127 | 27, 27-4, 27k, 27K, 27?, 127, 127K, 127k, and 127-3 |
| 28 / 128 | 28, 28-3, 28K, 28k, 128, 128K, 128k, and 128-3. The industrial 281K23 is excluded and counted in “other.” |
| 301 / 401 / 404 / 500 | 301, 401, 404, and 500; these quantities are not a count of Model 301 alone. |
| 66 group | 66, 66-6, 66-10, 66-14, 66K, 66k, 66 (Gear), and 66-1 |
| 99 group | 185, 185K 99K, 185K, 185/192/99K, 185/99/192K, 99, 99K, 99k, 99K 185K, 99-185-192K, 99K-185K-192K, 99/192/185K, 99/185/192K, 99W, 192K, and 192/185/99K |
| Other | All remaining entries, including industrial machines and models outside the selected groups. |
For the size comparison, full-size combines the 101, 15, 201, 27/127, 301/401/404/500, and 66 groups. Compact combines the 28/128, 99, and 221/222 groups. “Other” remains separate and is included in the denominator for the percentages. Percentages are rounded to one decimal place, so they may not sum to exactly 100%.
The annual figure sums the same groups by the year recorded in the compilation. Changes can reflect record coverage and allocation timing as well as changes in manufacture. The figures alone do not establish the causes of particular peaks or troughs.
Group totals and recorded date range
The dates below are the earliest and latest years with a positive recorded quantity in each group within the 1900–1963 analysis period. They are not necessarily the first or last years those models were manufactured. Totals are the summed quantities in the included records, including allocations, rather than independently verified counts of completed machines.
| Group category | Earliest recorded year | Latest recorded year | Total machines in the records |
|---|---|---|---|
| 15 group | 1900 | 1963 | 26,126,537 |
| 101 | 1920 | 1932 | 230,475 |
| 201 group | 1932 | 1961 | 2,529,818 |
| 221 / 222 | 1933 | 1961 | 2,133,817 |
| 27 / 127 | 1900 | 1941 | 7,507,302 |
| 28 / 128 | 1900 | 1962 | 10,613,336 |
| 301 / 401 / 404 / 500 | 1951 | 1963 | 401,536 |
| 66 group | 1902 | 1956 | 8,906,297 |
| 99 group | 1911 | 1963 | 5,106,107 |
| Other | 1900 | 1963 | 13,563,266 |
| All groups | 1900 | 1963 | 77,118,491 |
Have a machine or a question to share?
Get in touch with Duncan ↗